Main Page: Difference between revisions
Jump to navigation
Jump to search
No edit summary |
No edit summary |
||
| Line 19: | Line 19: | ||
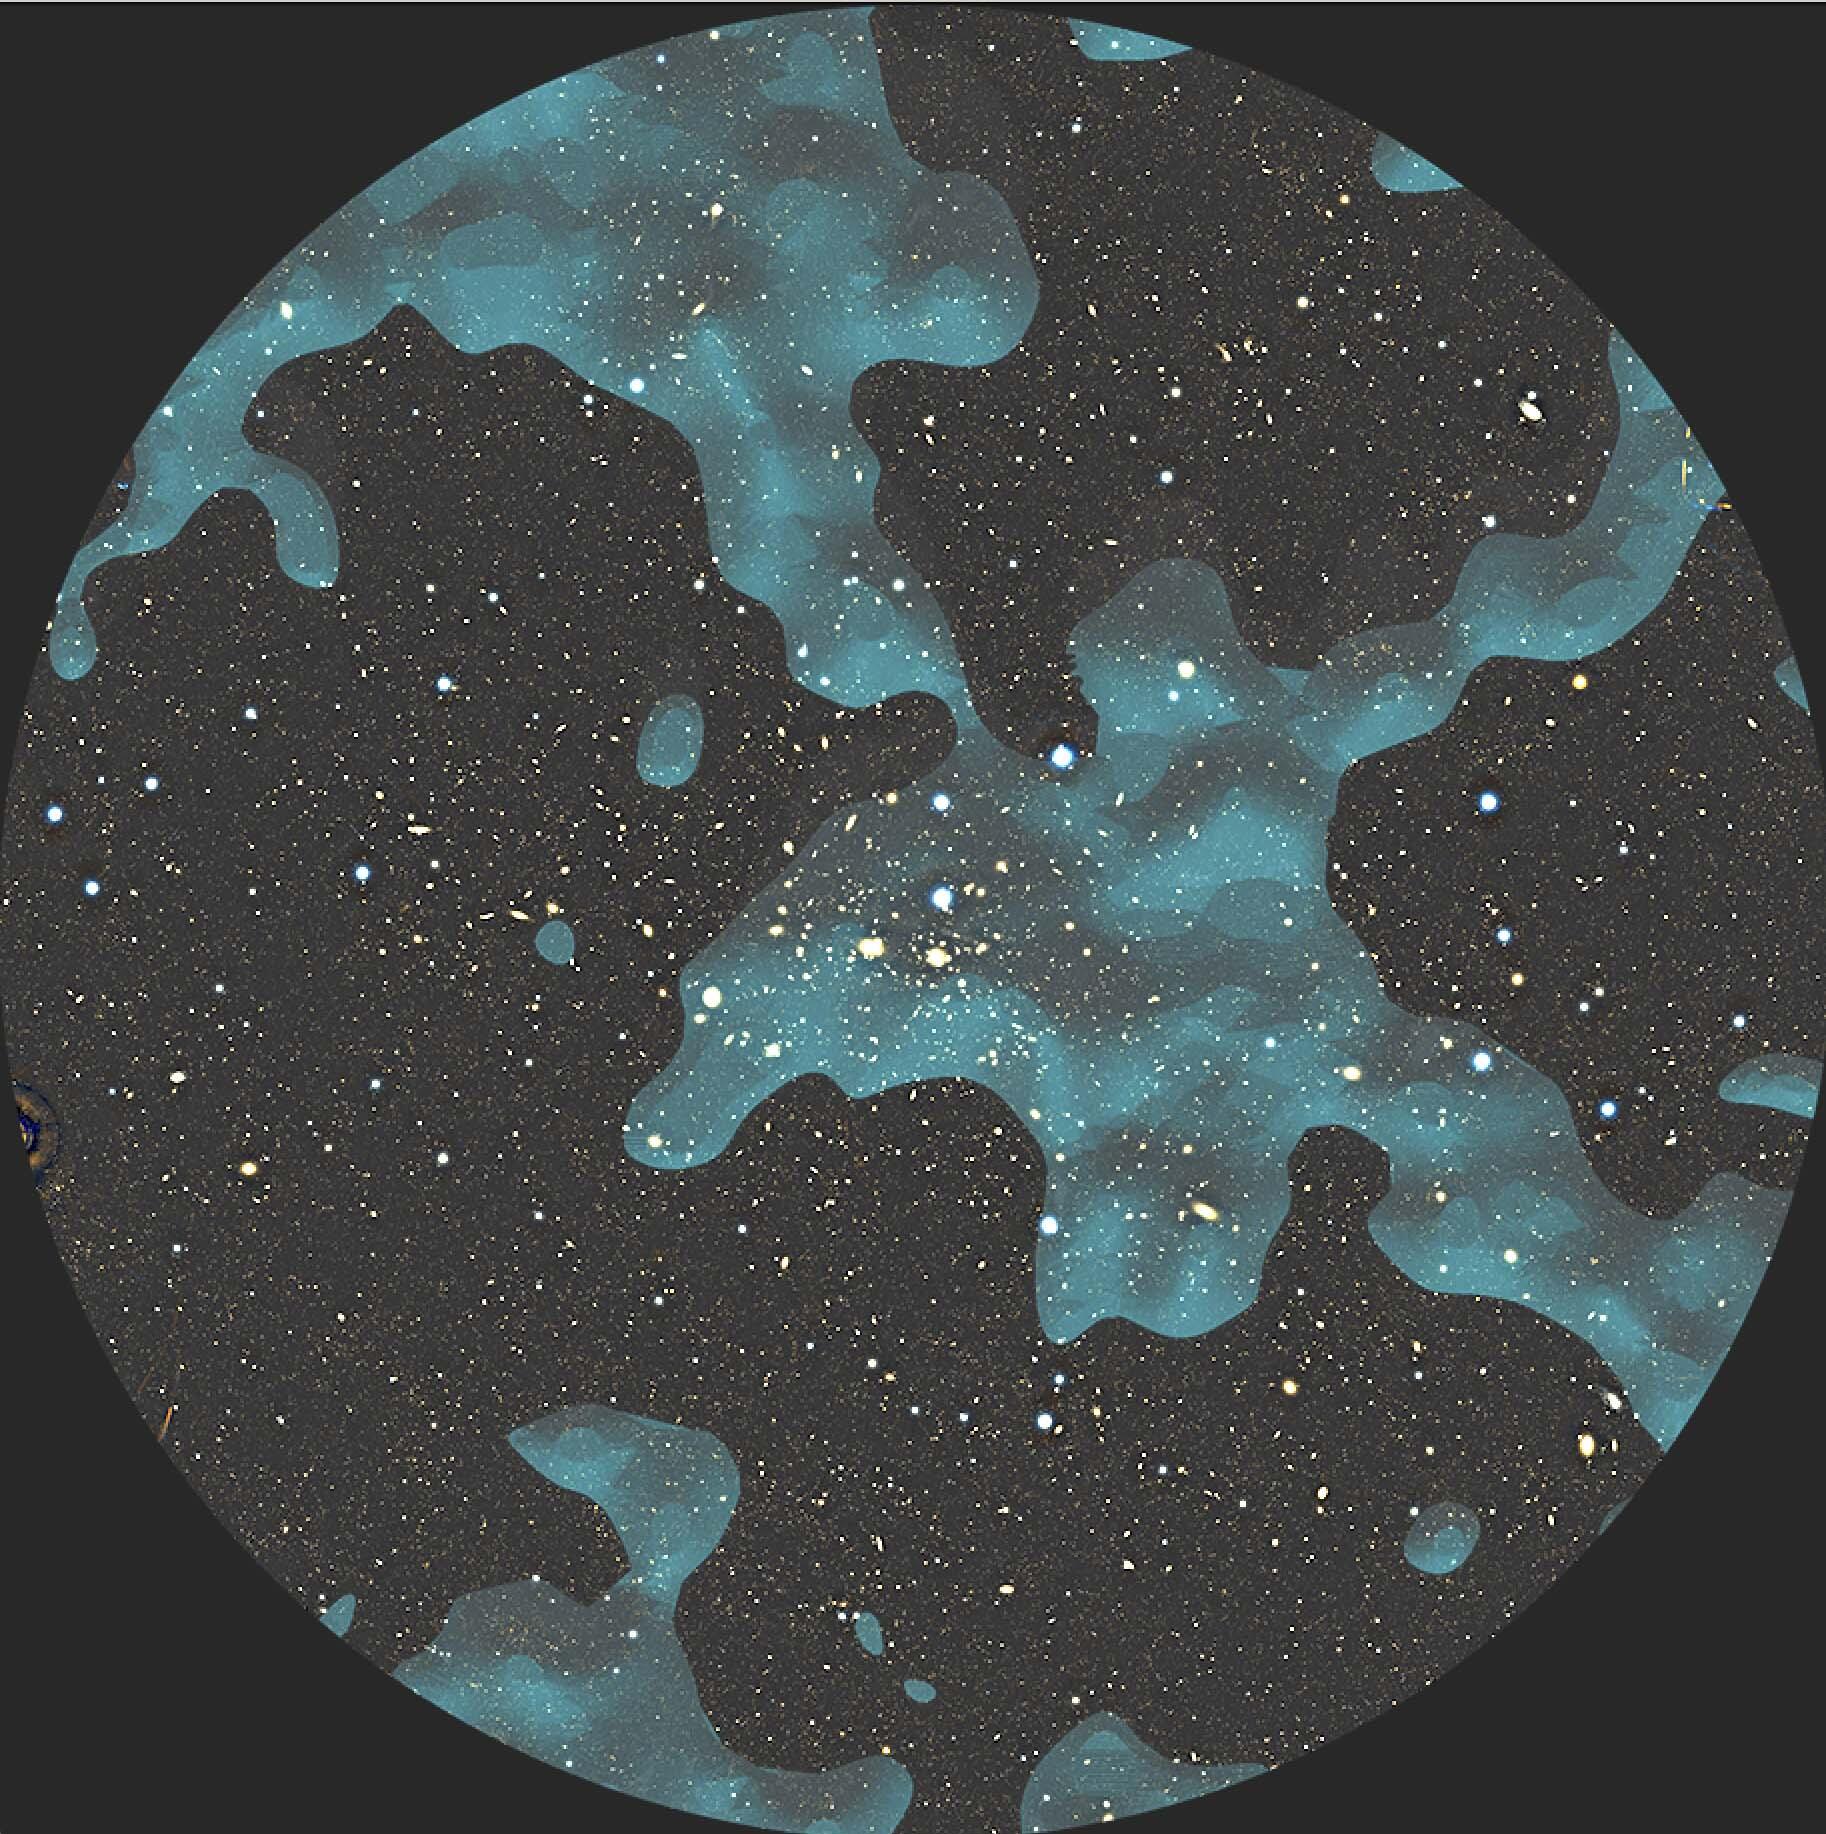
<br> Dark matter in the Coma Cluster region. The distribution of dark matter calculated based on this research (dark green cloud) is overlayed on an image of the Coma Cluster and more distant background galaxies taken by the Subaru Telescope. Strands of dark matter can be seen extending millions of light years. | <br> Dark matter in the Coma Cluster region. The distribution of dark matter calculated based on this research (dark green cloud) is overlayed on an image of the Coma Cluster and more distant background galaxies taken by the Subaru Telescope. Strands of dark matter can be seen extending millions of light years. | ||
|- | |- | ||
| [[File:nature2023.jpg|400px]] || style="padding: 50px" |[[File:icl_evolution.jpg|300px]] | |||
<br> | |||
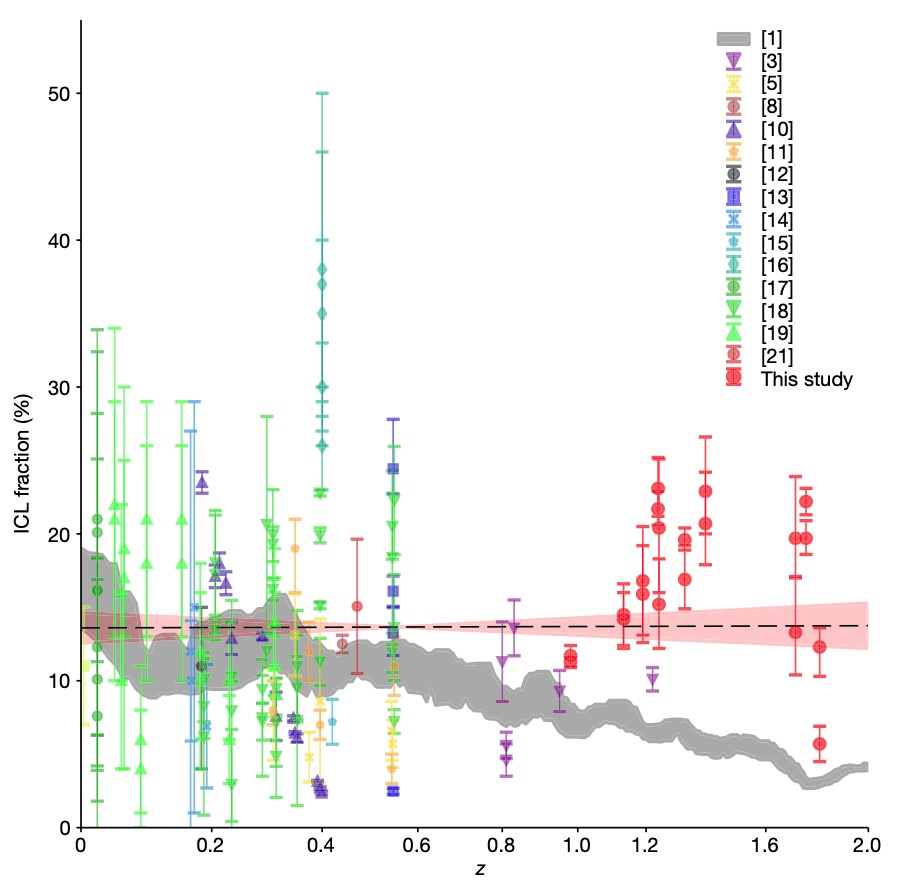
ICL fraction evolution. Filled red circles are the current results. We extrapolated the best-fit Sérsic profiles to the same aperture to estimate the total ICL flux. The dashed line and pink shade show the best-fit linear regression and its 68% uncertainty, respectively. We weighted all data points equally and adjusted them in such a way that the reduced χ2 value becomes unity. The comparison between our high-redshift and the literature low-redshift samples shows that there is no significant evolution of the ICL fraction with redshift in observation, which contradicts the current theoretical prediction. | |||
|} | |} | ||
Revision as of 13:45, 22 May 2024
Welcome to Yonsei Observable UNiverse Group (YOUNG)
Publication in ADS
Google scholar
Research highlights
